
What "Traditional" Power Supply Actually Means for a Commercial Site
For most commercial and industrial (C&I) facilities, "traditional" power means one of two things: electricity purchased from the utility under a volumetric-plus-demand tariff, or on-site generation from diesel or natural-gas gensets. The utility model bundles an energy charge (cents per kWh), a demand charge (dollars per peak kW), and fixed customer charges, all reset periodically through a regulatory rate case. The genset model is pure operating expense — fuel, filters, oil, coolant and overhaul — and its cost scales linearly with run hours. Neither option offers the facility owner a fixed, predictable long-term price, which is precisely the gap that commercial solar addresses.
The comparison is also structurally asymmetric. Traditional supply is almost entirely operating expenditure: no capital outlay, no asset on the balance sheet, but full exposure to tariff and fuel escalation. A commercial solar array is capex-heavy on day one and nearly free to operate thereafter, with a 25–30 year asset life. The savings case therefore depends entirely on the retail rate it displaces. According to the U.S. Energy Information Administration, average commercial retail rates were roughly 12–13 ¢/kWh nationally in 2024, but 25–30 ¢/kWh in California and Massachusetts and above 35 ¢/kWh in Hawaii — the markets where solar economics shift most dramatically.
Levelized Cost: Commercial Solar vs Tariffs and Diesel
Levelized cost of energy (LCOE) makes the gap legible. Lazard's annual LCOE analysis places the cheapest utility-scale solar projects in the $30–$60/MWh band, while commercial rooftop systems typically land between $60 and $120/MWh depending on scale and market. Diesel generation, by contrast, frequently exceeds $250/MWh once fuel at $1.00–$1.50 per litre, maintenance and engine overhaul are counted. Set that against a retail tariff: 13 ¢/kWh equals $130/MWh, and 25 ¢/kWh equals $250/MWh. Commercial solar therefore undercuts grid supply across most of the United States, Europe and Australia, and displaces diesel almost everywhere it is deployed.
Capital costs have fallen far enough to make that arithmetic durable. BloombergNEF reported global module prices falling to roughly $0.09–$0.12 per watt in 2024, meaning panels now represent only about a quarter of installed system cost. NREL's cost benchmarks put U.S. commercial rooftop PV at approximately $1.50–$2.00 per watt DC before incentives, with balance of system, labour, engineering and interconnection dominating the stack. A 30% investment tax credit plus five-year MACRS depreciation reduces effective net cost by 40–50%, compressing simple payback to four to seven years in high-tariff markets and stretching it beyond ten in low-rate jurisdictions.
Technical Architecture: Inverters, Racking and Hybrid Integration
A modern commercial system is built from n-type TOPCon modules rated 21–22.8% efficiency and 550–620 W per panel, mounted on ballasted or penetrating racking and wired to three-phase string inverters in the 50–125 kW class with weighted efficiencies of 97.5–98.5%. Modern [commercial solar panels](/products/solar-panels) carry 25–30 year performance warranties with degradation guaranteed below 0.55% per year, and DC voltages now run at 1,000–1,500 V to reduce conductor losses. Inverter selection and string design determine yield more than any other single decision, which is why the [inverter architecture and monitoring layer](/tech/inverters) deserves the same engineering scrutiny as the modules themselves.
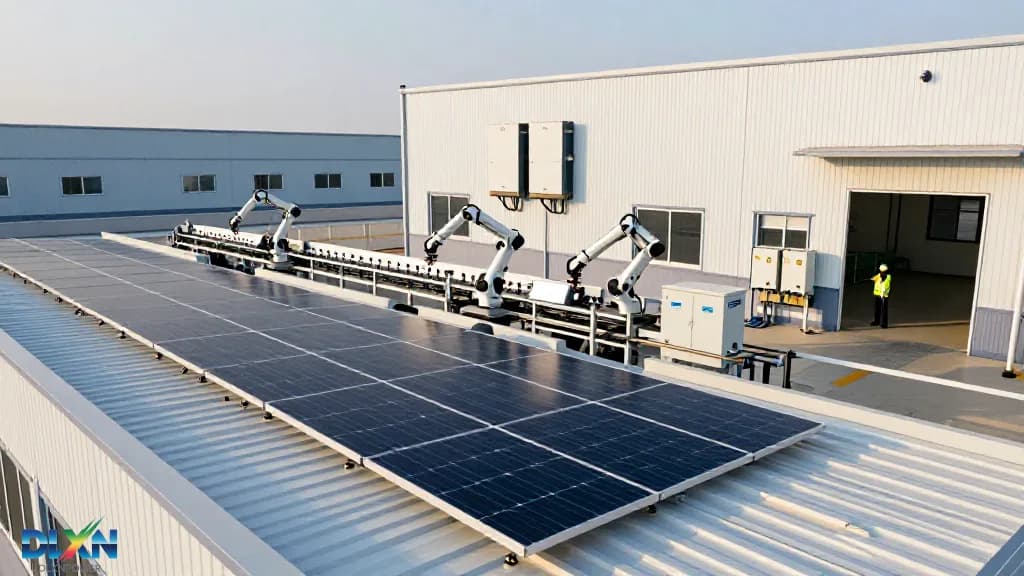
Integration with legacy infrastructure is where commercial projects succeed or fail. The array is typically interconnected at the main switchboard, with current transformers metering import and export, and the automatic transfer switch re-coordinated so a standby genset can never back-feed the PV. Hybrid inverters can now operate grid-forming, holding voltage and frequency to run islanded loads when the utility drops, and they arbitrate between PV, battery and generator in real time. That capability turns a solar array from a simple bill-reduction asset into a controllable distributed energy resource — something a tariff-only supply arrangement can never provide.
Closing the 24/7 Gap: Storage and Demand Charges
Demand charges are the hidden half of the commercial electricity bill, frequently accounting for 30–50% of the total on tariffs with high $/kW components. Solar alone shaves mid-day peaks, but its output collapses exactly when many facilities hit their afternoon or evening maximum. Pairing PV with lithium iron phosphate (LFP) storage closes that gap: LFP cells deliver 6,000–8,000 cycles at 80% depth of discharge with 88–92% AC round-trip efficiency, giving a decade or more of daily peak-shaving. A correctly sized [lithium battery system](/products/lithium-battery) can cut billed demand by 15–30% while shifting excess solar generation into evening load.
Where a facility genuinely needs firm 24/7 supply — cold storage, telecom sites, remote mining — the comparison is no longer solar versus grid, but solar-plus-storage versus diesel. BloombergNEF has repeatedly shown that new solar-plus-storage is cost-competitive with new gas peaking capacity, and in off-grid settings it displaces diesel outright once fuel logistics are counted. Typical commercial configurations run a 1 MW PV array against a 250–500 kW inverter block and a 500 kWh–1 MWh battery. The engineering detail of [battery storage sizing and dispatch](/tech/battery-storage) — depth of discharge, C-rate and augmentation scheduling — determines whether the economics hold across a 20-year horizon.
Measured Performance and Payback from Operating Systems
Real operating data confirms the model. Commercial arrays in decent irradiance produce specific yields of 1,400–1,600 kWh per kWp annually, with O&M costs of roughly $10–$18 per kW per year and one inverter replacement budgeted at year 12–15. Across the [portfolio of commercial and industrial projects](/projects) typical of temperate and subtropical markets, owners consistently see 20–35% reductions in purchased kilowatt-hours and 15–25% reductions in total electricity spend, because demand charges and volumetric charges fall together. Degradation of 0.45–0.55% per year means year-25 output still exceeds 85% of nameplate capacity.
Payback depends almost entirely on the displaced tariff. At 25 ¢/kWh, a $1.70/W system with a 30% tax credit and accelerated depreciation repays in roughly four to five years; at 8 ¢/kWh the same system stretches past ten years and generally requires third-party financing to proceed. Diesel-off hybrid projects show the shortest horizons of all, often three to four years, because fuel delivery to remote sites carries its own logistics premium. Sensitivity matters too: a 4% annual tariff escalation — well within historical norms — improves the 25-year internal rate of return by several percentage points.
Procurement, Regulation and Where Traditional Still Wins
Procurement structures have diversified alongside the technology. Cash purchase maximises returns but ties up capital; power purchase agreements and solar leases shift upfront cost to a third party in exchange for a 20–25 year price below retail. The U.S. investment tax credit now carries adders worth 10% each for domestic content and energy-community siting, and transferability provisions let tax-exempt entities monetise credits directly. Meanwhile net-metering reforms — notably California's NEM 3.0, which cut export compensation by roughly 75% — have shifted design priorities from export maximisation toward self-consumption and storage, changing sizing assumptions across the industry.
Traditional supply still wins under specific conditions, and a credible analysis should say so. Where commercial tariffs sit below about 8 ¢/kWh, roofs are shaded or structurally marginal, the tenant's lease is shorter than the payback period, or loads are dominated by night shifts with no storage budget, solar delivers weak returns. High-latitude sites with heavy snow cover and low winter irradiance also compress yield. The defensible conclusion is rarely "solar versus traditional" but a sequenced approach: efficiency first, then solar for the daytime block, then storage for peak and resilience, with the utility or a genset covering the residual. That hybrid architecture is what most successful commercial projects now look like.