Why C&I Storage Economics Changed in 2024–2025
The cost floor for C&I storage moved sharply in 2024. According to BloombergNEF's annual Battery Price Survey, the volume-weighted average lithium-ion pack price fell to roughly $115/kWh, a 20% decline from about $139/kWh in 2023 and the largest single-year drop since 2017. LFP cell prices in China dipped below $60/kWh at points during 2024. Turnkey installed C&I systems in North America now land between $250 and $450/kWh depending on duration, enclosure type, and interconnection complexity, compared with $700+/kWh in 2021.
Demand-side policy reinforced the trend. The US Inflation Reduction Act created a 30% investment tax credit for standalone storage with no requirement that the system charge from solar, and added 10% bonuses for domestic content and energy-community siting. The IEA's 2024 report Batteries and Secure Energy Transitions notes that battery costs have fallen roughly 90% since 2010 and that reaching net-zero targets implies about 1,500 GW of battery deployment by 2030.
Behind-the-meter C&I remains a small share of that total. Wood Mackenzie's US Energy Storage Monitor has consistently shown the non-residential segment at under 5% of annual US deployments, dwarfed by utility-scale. That imbalance is the opportunity: warehouses, cold storage, food processing, plastics, data centers, and retail portfolios with 400 kW–5 MW peaks are largely unpenetrated. A solid technical foundation in [battery storage architecture](/tech/battery-storage) is the prerequisite before any quote is signed.
Step 1: Load Profiling and Site Assessment
Sizing starts with interval data, not with a product datasheet. Pull at least 12 months of utility meter data at 15-minute resolution — and 1-minute data if the site has high-cycling loads such as compressors, injection molding, or arc furnaces. The goal is to identify the top 20 peak-demand intervals, the load factor, and the shape of the daily profile. A facility running at 40% load factor with a 1 MW peak has far more shaveable demand than one running at 85%.
Demand charges are the economic engine. In the United States they typically range from $10 to $25 per kW per month, and in constrained territories such as Con Edison's New York service area they can exceed $30/kW in summer months. A 400 kW reduction on a $20/kW tariff saves $96,000 annually before any energy arbitrage. Ratchet clauses — where a single 15-minute spike sets the billing demand for 11 or 12 months — are common on larger C&I accounts and must be modeled explicitly, because they change the value of a single avoided spike dramatically.
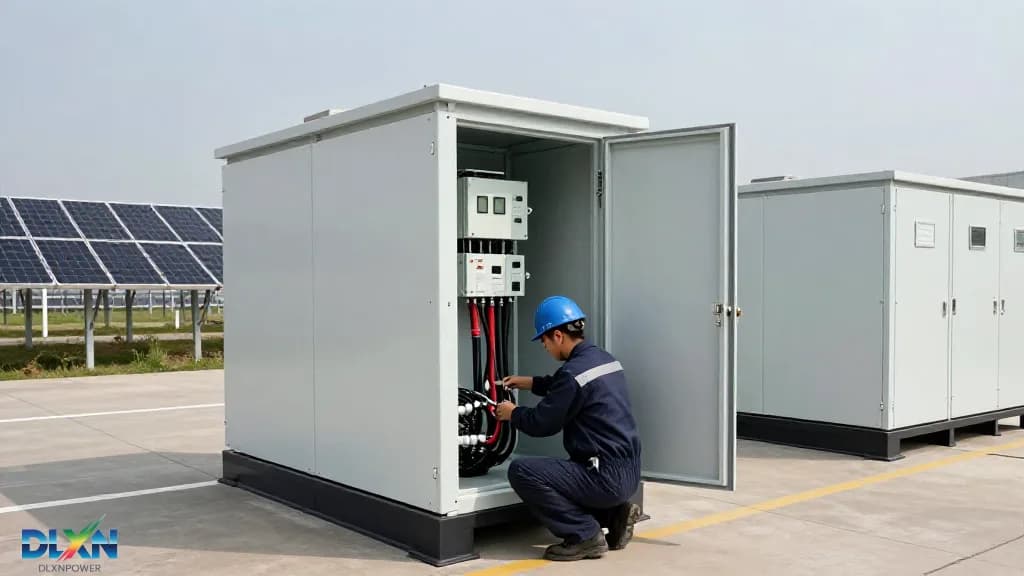
Physical assessment comes next. Confirm pad or wall space, the 3-meter separation envelope required by NFPA 855, existing transformer spare capacity, available fault current at the point of interconnection, conduit routing, and crane access for containerized units. Sites with limited ground area often benefit from co-locating storage with a solar canopy, where the [EOS carport](/eos-carport) structure provides both generation and a mounting envelope for enclosures.
Step 2: Sizing Power, Energy, and C-Rate
Separate the power rating (kW) from the energy rating (kWh) in every calculation. The power rating determines how much demand you can shave; the energy rating determines for how long. Most C&I systems today are specified as 2-hour (0.5C) or 4-hour (0.25C) LFP systems, with 2-hour units favored for demand-charge-only use cases and 4-hour units for arbitrage, resiliency, and capacity programs.
Work an example. A facility peaks at 800 kW and the owner targets a 200 kW reduction sustained for three hours. That is 600 kWh delivered at the meter. Adjust for the usable state-of-charge window (typically 90% depth of discharge), AC round-trip efficiency (85–88% for AC-coupled systems), and auxiliary loads, and the nameplate requirement becomes roughly 600 ÷ 0.90 ÷ 0.87 ≈ 766 kWh. Add a 10–15% buffer for degradation over the warranty term and specify approximately 850 kWh.
Degradation is not a footnote. Modern LFP cells are warranted to 6,000–8,000 cycles at 70–80% state of health, which for one cycle per weekday is a 10–15 year horizon. Two-hour systems cycling twice daily will hit augmentation earlier. Plan for a capacity top-up in year 6–8, and confirm whether the warranty is energy-throughput-limited or time-limited. A detailed review of [lithium battery specifications](/products/lithium-battery) should cover cycle life at the actual C-rate, not just the headline number.
Step 3: Electrical Integration and Interconnection
The first architectural decision is AC-coupled versus DC-coupled. AC-coupled systems place the battery and its power conversion system on the facility's AC bus, which makes retrofits straightforward and keeps the storage independent of existing solar inverters. DC-coupled designs, typically built around a hybrid inverter, can capture higher round-trip efficiency — 88–92% versus 85–88% — by avoiding a double conversion, but they complicate string-level design and are best specified where storage and PV are installed together.
Interconnection hardware must satisfy the 2023 NEC in full. Article 706 governs energy storage systems, Article 705 governs interactive interconnection, and Article 480 covers battery banks. Typical C&I systems operate at 480 V three-phase and step up to 13.8 kV medium voltage for larger installations. Any added source of fault current changes the available fault current at existing switchgear, so a short-circuit study and protective device coordination study are mandatory deliverables, not optional ones.
Inverter compliance is the other gate. Units must be listed to UL 1741 SB and certified to IEEE 1547-2018, which requires voltage ride-through, frequency ride-through, volt-VAR, and frequency-watt functions. Utilities increasingly require these smart-inverter capabilities as a condition of interconnection. Reviewing [inverter specifications](/tech/inverters) against the specific utility's interconnection tariff before ordering is far cheaper than replacing firmware later.
Step 4: Safety, Fire Code, and Thermal Design
Fire code drives layout more than any other variable. NFPA 855 (2023 edition) and the International Fire Code Section 1207 require outdoor units to be spaced at least 3 meters from lot lines, buildings, and combustible materials. That distance can be reduced when UL 9540A large-scale fire test data demonstrates no cell-to-cell propagation, but the reduction must be documented and accepted by the authority having jurisdiction. Indoor installations face stricter limits, often capped at 50 kWh per unit in certain occupancies.
Listing is non-negotiable. The complete system should carry UL 9540 listing; cells and modules should be UL 1973; and UL 9540A test reports should be available for the specific enclosure, not a similar one. Beyond code, specify gas detection for flammable off-gas, mechanical exhaust or deflagration venting on enclosed units, and emergency stop hardware within sight of the enclosure.
Thermal design determines both safety margin and warranty validity. LFP cells perform best between 15°C and 35°C, and cell-to-cell temperature differential should stay under 3–5°C to avoid accelerated divergence. Liquid-cooled HVAC systems hold tighter tolerances than air-cooled designs and are the default for humid or dusty industrial environments. Verify IP ratings against site conditions — outdoor washdown areas and food plants need higher ingress protection than a clean warehouse mezzanine.
Step 5: Commissioning, EMS Configuration, and Demand Charge Management
Commissioning should produce measured data, not checkboxes. The core acceptance tests are an AC-side capacity test (usable kWh measured at the PCS terminals), a round-trip efficiency test at the expected duty cycle, ramp-rate verification, reactive power capability, and a functional test of every protective trip and emergency stop. If the system islands for backup power, test the transition and the black-start sequence. IEEE 1547 conformance should be validated against the utility's specific test protocol.
The energy management system (EMS) is where value is won or lost. Rule-based controls are adequate for simple TOU shifting, but demand-charge management benefits from predictive logic: a model-predictive or machine-learning controller that forecasts the day's peak and discharges with a defined deadband avoids both under-dispatching and premature depletion. OpenADR 2.0b support is effectively mandatory if the site will participate in demand response programs.
Budget a tuning period. Most integrators recommend 6–12 months of operation with monthly review of dispatch logs against actual billing demand before the control strategy is considered final. Seasonal load shifts, new equipment, and tariff changes all degrade a static schedule. A commissioning report that ends at "system online" is a red flag; the best handover packages include a documented tuning plan and a named controls engineer.
Step 6: Economics, Incentives, and Typical Payback
Installed cost for a 2–4 hour C&I system in North America currently falls between $250 and $450/kWh, with 4-hour systems at the lower end of that range on a per-kWh basis. Comparable systems in China and parts of Europe price at $150–$250/kWh. On the incentive side, the US federal ITC provides a 30% base credit for standalone storage, with 10% adders for domestic content and energy-community siting; the full rate requires compliance with prevailing wage and apprenticeship rules. Five-year MACRS depreciation applies on top, and state programs such as California's SGIP and NYSERDA's incentives can add further support.
Revenue stacking drives the payback number. Demand charge reduction is typically worth $10–$25 per kW per month, TOU energy arbitrage adds $20–$60/kWh-year depending on the tariff spread, and demand response participation contributes $50–$200 per kW-year. Resilience value — avoided outage losses — is real but harder to monetize; it justifies projects at the margin rather than at the core. In high-demand-charge markets, paybacks of 4–8 years are now common; in low-spread markets, 6–10 years is realistic.
The practical conclusion for 2025 is that C&I storage is no longer a technology bet but an engineering exercise. The projects that underperform are almost always the ones that skipped interval-data analysis, undersized for degradation, or handed controls off without a tuning plan. Getting the sequence right — data, sizing, electrical integration, code compliance, commissioning, then economics — is what separates a 5-year payback from a stranded asset. Reviewed [commercial project case studies](/projects) show the same pattern repeatedly: rigorous front-end engineering is the highest-return line item in the budget.