
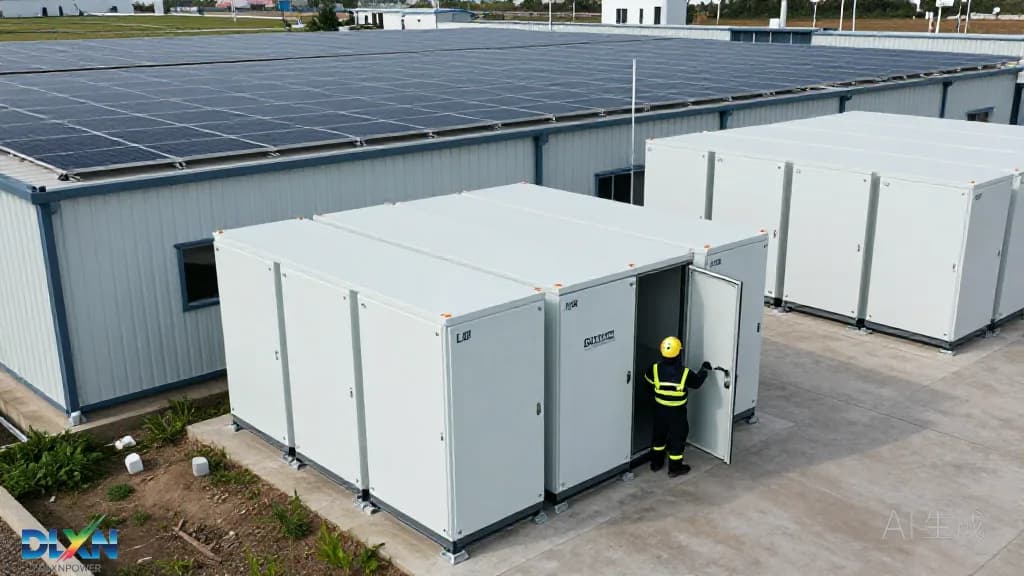
Why C&I Storage Has Moved From Pilot to Portfolio
The market context is no longer speculative. According to BloombergNEF, global stationary storage additions crossed 60 GW in 2024 and are tracking toward more than 100 GW of annual deployment by the end of the decade, with behind-the-meter commercial systems taking a growing share as cell prices fall. The IEA's Batteries and Secure Energy Transitions report notes that battery pack costs have dropped roughly 90% since 2010 and that cumulative battery deployment must reach about 1,300 GW by 2030 in a net-zero pathway — a signal that C&I buyers are now purchasing into a mature supply chain rather than an emerging one.
The economics have shifted decisively. For a typical commercial customer, demand charges represent 30–50% of the monthly electricity bill; the U.S. Energy Information Administration pegs average commercial rates near 12–13 ¢/kWh, but coincident peak demand charges can exceed $20/kW-month in markets such as California, New York and parts of Texas. A 500 kW / 1.1 MWh system that shaves 200 kW off a facility's monthly peak can save $48,000 per year at that rate, before any energy arbitrage. Layer on the 30% federal investment tax credit for standalone storage in the U.S., state programmes such as SGIP and the Clean Peak Standard, and European capacity markets, and payback periods of five to eight years become achievable.
What separates a bankable project from an expensive disappointment is execution. Roughly 70% of underperforming C&I storage assets traced by integrators fail on specification and commissioning issues rather than on cell chemistry — undersized switchgear, optimistic degradation assumptions, or controls that never actually dispatch against the tariff. The sections that follow treat installation as an engineering discipline, from interval data to acceptance testing. Readers comparing architectures should start with our overview of [battery storage technology](/tech/battery-storage) before committing to a topology.
Load Profiling and Site Assessment: The Data That Decides Everything
No sizing decision should be made before 12 months of 15-minute interval data is in hand — ideally 24 months where the facility has added loads. The goal is to separate three distinct value streams: peak demand reduction (needs power and a fast response), time-of-use arbitrage (needs energy and round-trip efficiency), and backup or resilience (needs autonomy hours and islanding capability). A cold-storage warehouse, for example, may present a nearly flat 800 kW baseload with a 40-minute defrost spike; a plastics extruder shows the opposite profile. NREL's load-profile research consistently shows that C&I demand is far more heterogeneous than residential, so portfolio-level assumptions transfer poorly between sites.
The electrical audit is equally unforgiving. Verify transformer capacity and spare headroom, existing switchgear ratings, available fault current, and the busbar configuration that governs where the storage feeder can legally land under NEC 705.12. Many retrofits fail at this step: a site with a 1,000 kVA transformer serving an 800 kW peak has only 200 kVA of headroom, which caps the battery's power rating regardless of what the tariff analysis recommends. Harmonic studies matter where the facility already runs VFD-heavy loads, and grounding topology determines whether the inverter can operate in grid-following or must support grid-forming functions.
Physical site conditions close the assessment. Measure available pad area with NFPA 855 separation distances applied, confirm fork-lift and crane access, check the floodplain and drainage, and verify structural capacity if equipment goes on a roof. Acoustic limits frequently bind in urban and suburban sites — keep inverter and HVAC noise at or below 55 dBA at the property line. Where the project includes generation, panel-level review of roof structure and shading belongs here too; our [solar panels](/products/solar-panels) specification sheets list the per-module weights and clamp zones needed for that calculation.
Sizing the Battery, Inverter and PV Coupling Ratio
Start with the two independent variables: energy capacity in kWh and power capacity in kW. C&I systems typically run at 0.25C to 0.5C — a two- to four-hour duration — because the tariff structure rewards peak shaving over long discharge. NREL's cost benchmarking repeatedly shows C&I systems carrying a 30–60% $/kWh premium over utility-scale BESS, driven by smaller procurement volumes, balance-of-system overhead and site-specific engineering. That premium means oversizing "just in case" is expensive; size to the measured load, then add no more than a 10–15% margin for degradation and future load growth.
Coupling architecture drives efficiency and cost. AC-coupled systems, where the battery has its own inverter, are simpler to retrofit and let the storage dispatch independently of PV; expect 85–88% round-trip efficiency AC-to-AC. DC-coupled systems share the PV inverter and capture clipped energy, reaching 88–92% round-trip, but complicate the DC/AC ratio and require careful voltage-window design. For PV-coupled projects, a DC/AC ratio of 1.2–1.4 on the PV side is common in C&I, while the storage inverter's continuous rating should exceed the battery's maximum discharge power by 10% to avoid clipping the battery itself. Our [hybrid inverters](/tech/inverters) documentation covers the droop and Volt-VAR settings required by modern interconnection standards.
Degradation and augmentation are where financial models quietly break. LFP cells typically deliver 6,000–8,000 cycles to 70–80% state of health, but the warranty is a throughput guarantee, not a cycle count — a 1 MWh system cycling once daily at 90% depth of discharge will consume roughly 330 MWh of throughput per year. Specify a capacity test at year one and year five, confirm the augmentation schedule and its cost in the pro forma, and verify that the selected [lithium battery](/products/lithium-battery) cabinets have published UL 9540A cell-, module- and unit-level test data rather than a generic chemistry claim.
Safety, Codes and Interconnection Compliance
In North America, three documents govern the installation. UL 9540 certifies the energy storage system as a whole; UL 9540A provides the large-scale fire test data that jurisdictions use to relax spacing. NFPA 855 (2023 edition) then sets the field rules: three-foot separation between units and walls unless test data justifies reduced spacing, caps on aggregate capacity per fire area, mandated hazard mitigation analysis for larger installations, and requirements for fire detection, gas detection and emergency shutdown. The International Fire Code Chapters 12 and 32 add rooftop and indoor siting constraints, and UL 1973 governs the battery modules themselves.
Interconnection is governed by IEEE 1547-2018, which requires smart-inverter capabilities including voltage and frequency ride-through, Volt-VAR, Volt-Watt and frequency-watt response, plus a defined trip curve. Under FERC Order 2222, aggregated distributed storage can participate in wholesale markets, which raises the value of accurate telemetry and remote dispatch capability. Plan the utility study timeline early — in constrained U.S. territories, impact studies can run six to twelve months, and a detailed interconnection application with verified inverter settings avoids a costly second review.
Permitting and insurance deserve equal attention. Fire departments increasingly request the UL 9540A report, a site-specific emergency response plan and evidence of third-party commissioning. Insurers may require thermal barriers, separation from occupied structures, and documented maintenance intervals. Building owners should also confirm that the installer holds the relevant electrical licence and that the design package includes stamped structural and electrical drawings — a gap that surfaces at final inspection far more often than it should.
Thermal Management, Siting and Construction Execution
Thermal architecture is a first-order design choice, not a detail. Liquid-cooled cabinets hold tighter cell temperature spreads — typically within 3°C across a module — which extends cycle life and permits higher continuous C-rates in hot climates; air-cooled designs cost less up front but consume more auxiliary power and degrade faster above 35°C ambient. Auxiliary loads are not trivial: HVAC and thermal management can consume 3–8% of a system's throughput energy, which must be subtracted from the round-trip efficiency assumed in the financial model. In hot markets, specify a derating curve and confirm the cabinet's rated ambient envelope against the local design temperature.
Siting and civil works follow the fire code and the maintenance reality. Pads should be reinforced concrete, raised above the local flood elevation, with drainage graded away and bollards protecting the equipment from vehicle impact. Allow 1 m of working clearance in front of doors and 0.9 m between cabinets unless UL 9540A testing supports tighter spacing; confirm seismic anchorage for the site's zone and coordinate crane or fork-lift access before the pad is poured. Where the design includes canopies or carport-mounted generation, structural interfaces should be resolved on the same drawing set — our [EOS carport](/eos-carport) engineering package shows the typical load paths.
Construction sequencing is where schedules slip. Order long-lead switchgear and transformers first, then the battery cabinets, then the inverters; commission the AC collection system and verify phasing before energizing DC. Hold a pre-commissioning review that confirms torque values on DC terminations, insulation resistance on all strings, communications cabling continuity, and that the fire alarm interface has been tested end to end. Document everything photographically — the acceptance package is what protects the owner during warranty claims.
Commissioning, Controls and Revenue Stacking
Acceptance testing should be specified in the contract, not negotiated at the end. A credible protocol includes a nameplate capacity test at the point of common coupling, a round-trip efficiency measurement over a full cycle, verification of IEEE 1547 trip and ride-through settings with a programmable source, functional testing of the emergency stop and fire interface, and a 72-hour continuous operation run. Require the results in writing with measurement uncertainty stated; a capacity test that lands within 2% of nameplate at commissioning is normal for LFP and gives the owner a defensible baseline for future degradation claims.
Controls determine whether the asset earns money. The energy management system must ingest the utility tariff structure — demand ratchets, time-of-use windows, critical peak pricing events — and dispatch against it, not against a generic daily schedule. Validate the demand-charge logic against a simulated month of interval data before go-live, and confirm the peak-shaving algorithm responds within the meter's demand interval (15 or 30 minutes depending on the utility). Where ancillary revenues are available, verify that the site controller can accept external dispatch signals and that telemetry latency is under the market's requirement.
Post-commissioning, the operating discipline is straightforward but frequently neglected. Track monthly round-trip efficiency, state-of-health against the warranty curve, dispatch accuracy versus the tariff model, and alarm history; a 2% drift in round-trip efficiency usually signals a cooling fault or a failing string long before a hard failure appears. Annual capacity tests and thermal imaging of terminations catch the rest. Reviewing how these practices play out across real sites is easier with reference installations — see our [completed projects](/projects) for representative C&I configurations and their measured performance.