News & Updates
Latest from DLXN Energy
Q2 2026: solar power installation price holds near $2.60/W

U.S. residential pricing stays sticky
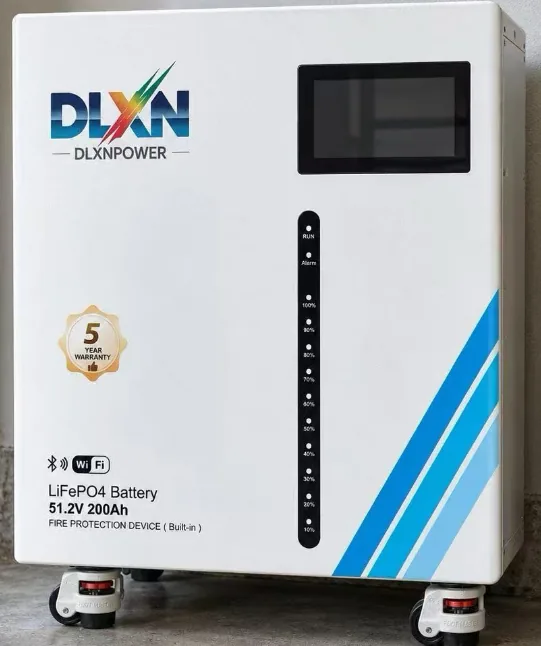
The U.S. residential solar power installation price in Q2 2026 is holding at roughly $2.50–$2.80/W before incentives, according to NREL’s Q1 2026 cost benchmark and Wood Mackenzie’s April installer survey. Module prices near $0.25–$0.30/W are not the problem; balance-of-system and soft costs still make up more than half the quote. Installers in California and New York report little room to cut labor, permitting or interconnection fees. Battery-backed systems, tracked in our residential ESS product line, add another line that many advertised quotes omit. Battery attachment is now the main quote variable. NREL puts residential storage adders at ~$1,000–$1,300/kWh installed in 2026, down from ~$1,200–$1,500/kWh in 2024 but still enough to push a 10 kWh system’s installed cost up by ~$10,000–$13,000. In markets with weak export compensation, that adder is often non-negotiable. Quote comparisons that omit storage, main panel upgrades or trenching understate the real solar power installation price. Wood Mackenzie’s installer survey shows the same pattern: headline module declines are visible, but quoted system prices are not falling at the same rate.
Utility-scale bids flatten as module prices slide
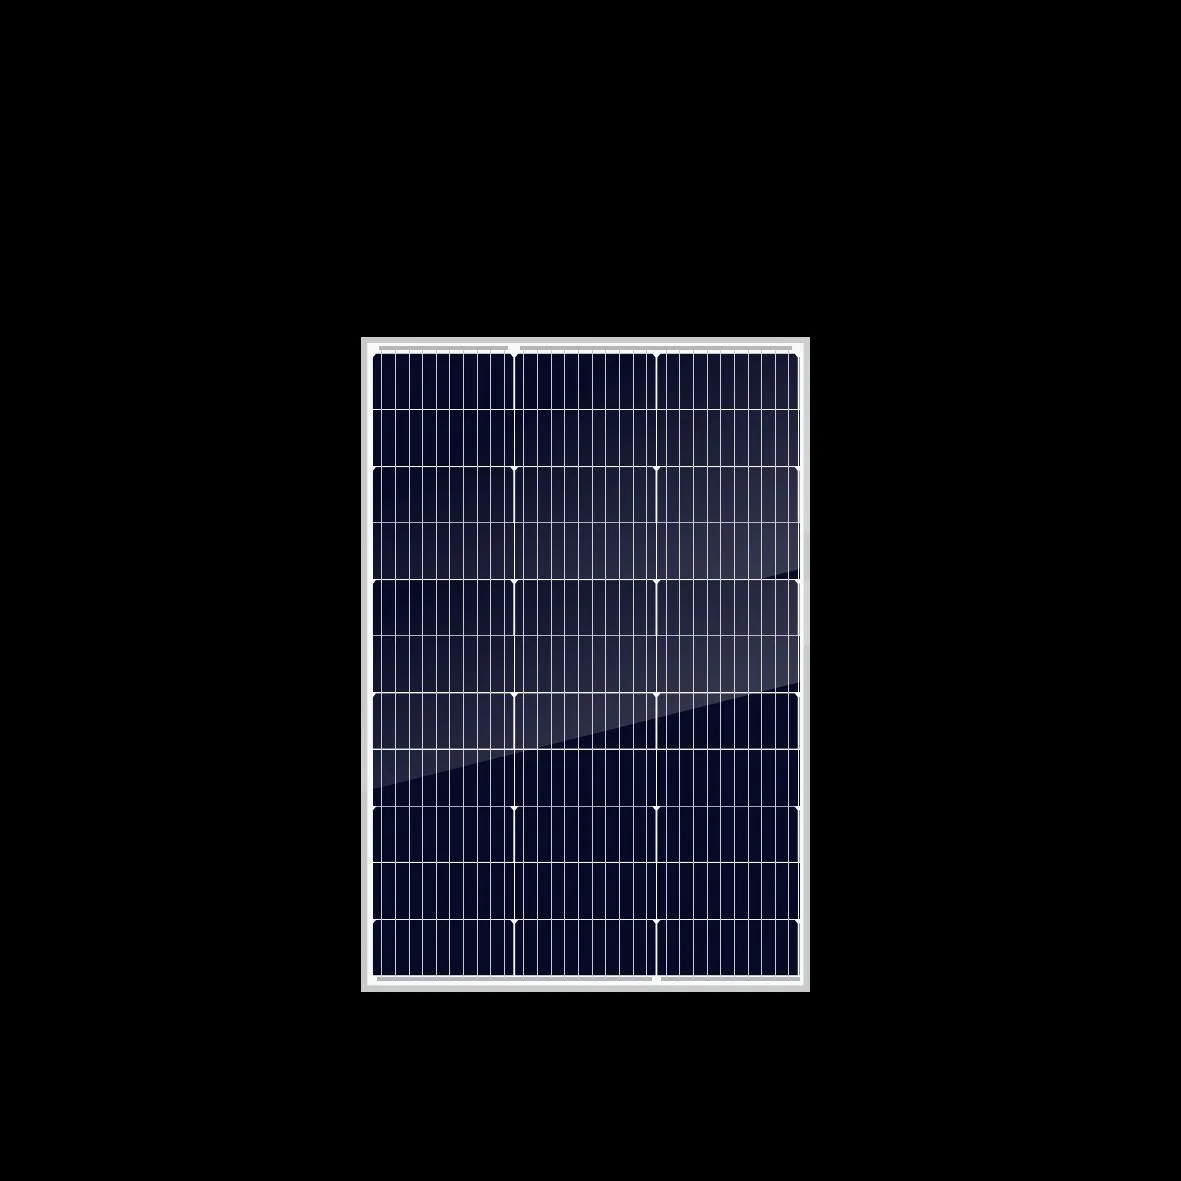
For utility-scale projects, the global solar power installation price is closer to $0.60–$0.90/W DC in 2026, depending on interconnection and terrain, per BloombergNEF’s April module and EPC note. Chinese module spot prices have stayed near $0.09–$0.12/W for TOPCon and PERC, while U.S.-delivered modules carry tariffs and logistics premiums. Developers are not passing all of that through to EPC bids; competition is too tight. Module specifications in our solar panel catalog show the same split between global spot pricing and delivered U.S. pricing. The catch is non-module equipment. Transformers, HV cable and inverters remain long-lead items, and interconnection queues in ERCOT, PJM and MISO still set project timing. Wood Mackenzie’s Q2 2026 North America PV outlook puts average utility-scale EPC costs flat year over year, not falling with module prices. That gap explains why headline module declines do not translate one-for-one into the final solar power installation price. Our project references show the same pattern: the civil, interconnect and commissioning scope often decides the bid, not the panel.
Batteries now set the marginal price
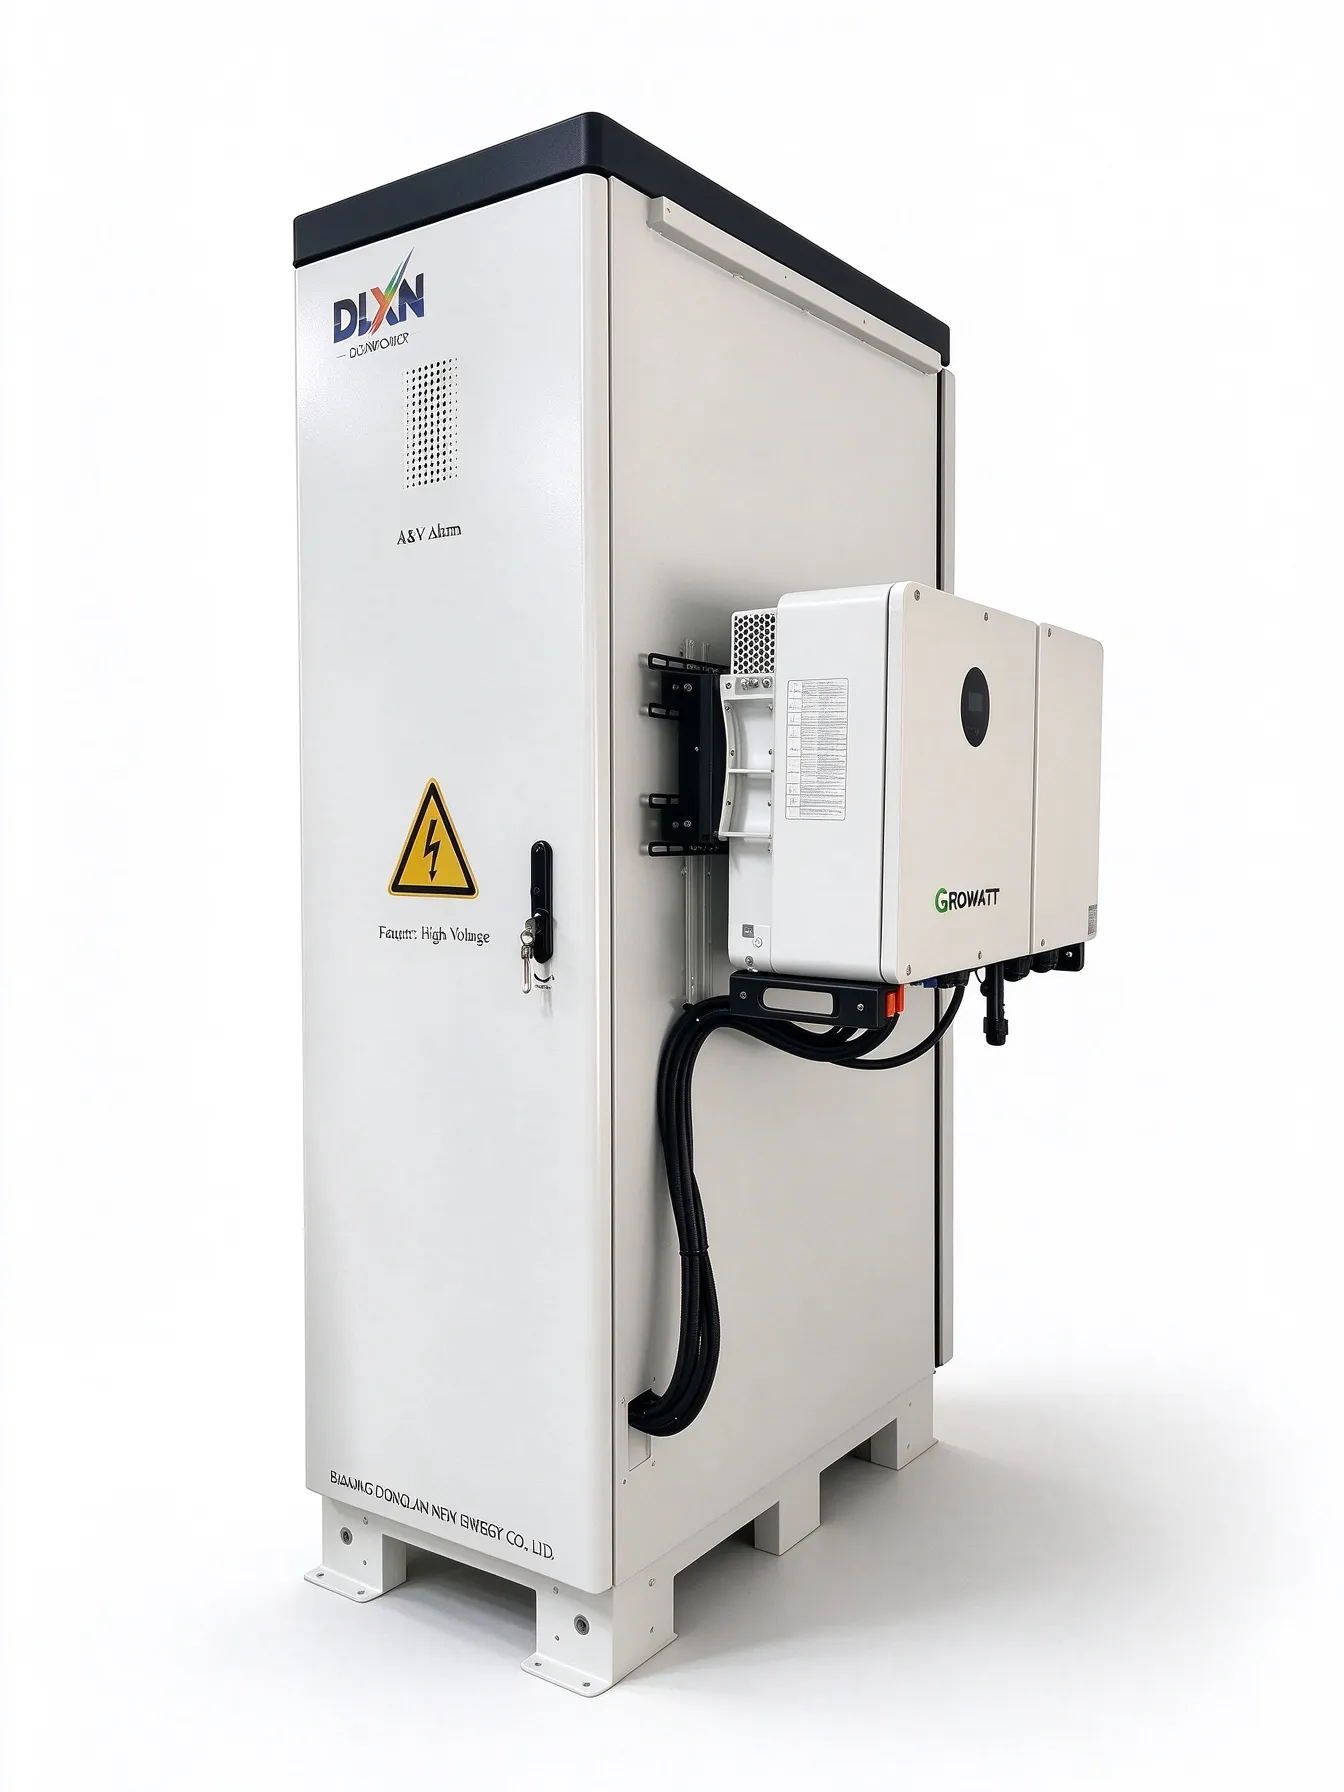
Storage is the largest swing factor in commercial and utility quotes. The DLXN LiFePO4 battery price index tracks LFP cells at roughly $70–$90/kWh in Q2 2026, before module, rack, PCS and commissioning costs. A turnkey 100 kWh C&I cabinet lands nearer $180–$260/kWh installed, depending on enclosure rating and grid code. That is down from 2024, but not enough to make storage free. The 100–120 kWh DLXN CGP-10 cabinet is one example of the form factor now common in behind-the-meter projects. For C&I buyers, the solar power installation price is increasingly quoted as a combined PV-plus-storage number. A 500 kW PV array with 1 MWh of storage may show a blended ~$1.20–$1.60/W, even though the PV alone is ~$0.80–$1.00/W. C&I ESS configurations with 100–120 kWh cabinets are common in behind-the-meter projects, but the economics depend on demand charges, not STC ratings. A quote that uses production incentives to justify storage is usually hiding a weak load profile.
Soft costs and permitting remain the stubborn line
NREL’s benchmark still puts residential non-hardware costs at ~$0.70–$1.00/W, including sales, design, permitting, interconnection and margin. Those line items are local. A rooftop in Arizona may clear permitting in two weeks; a project in parts of California or the Northeast can wait months for interconnection review. National averages hide that spread, and they make the advertised solar power installation price look more precise than it is. CPUC and state utility commission data show the same wide range in interconnection timelines. Labor is the other constraint. The U.S. solar workforce grew in 2025, but licensed electricians and certified installers remain tight in high-volume markets. Wage pressure is modest compared with 2022–2023, yet it is not reversing. Add-in costs for main panel upgrades, rapid shutdown and structural reinforcement can add ~$1,500–$4,000 to a residential job. Buyers comparing three quotes should normalize those scopes before treating any per-watt number as final. A low solar power installation price that excludes a panel upgrade is not a lower price; it is an incomplete scope.
What buyers should watch through 2026
Procurement teams should ask for line-item quotes, not blended per-watt pricing. Separate modules, inverters, racking, storage, labor, permitting and interconnection fees. Check module origin and tariff exposure, inverter lead times and whether the quoted solar power installation price includes monitoring, commissioning and warranty service. For C&I projects, model demand-charge savings and export limits separately; storage can improve resilience without improving payback. IEA PVPS data for 2026 show that installation cost breakdowns vary more by market than by module technology. The base case for 2026 is flat, not falling. BloombergNEF expects global module oversupply to persist, but U.S. tariffs and domestic-content rules keep delivered prices above global spot. Wood Mackenzie sees residential installation costs roughly flat through 2026, with utility-scale down modestly where interconnection is not the binding constraint. IEA PVPS data show installation costs diverging by market, not converging. The solar power installation price will remain a local number dressed up as a global one. Buyers who need a firm number should price a fully scoped design, not a national average. Policy is the wild card. Federal tax-credit rules and domestic-content adders change the effective economics, and the 2026 filing treatment depends on when a system is placed in service. Net-metering revisions in California, Arizona and several Northeastern states have already shifted payback calculations. A tariff ruling or a state interconnection reform can move the solar power installation price more than a $0.02/W module decline. Buyers should lock equipment pricing only after the utility has approved the interconnection scope, and they should treat any pre-approval quote as indicative rather than firm.
Related products
In-stock models that match this article — specs and RFQ on each page.