News & Updates
Latest from DLXN Energy
Residential Solar Efficiency: What the 2025 Gains Deliver

The cell no longer decides the outcome
Certified laboratory records have climbed past 27% for heterojunction cells and past 33% for perovskite-silicon tandems, yet the modules on a suburban roof in 2026 are still 22–23% efficient. That gap is not a failure of the industry; it is the cost of a 25-year weatherproof warranty, IEC 61215 certification and a bill of materials that a homeowner can actually finance. Fraunhofer ISE's Photovoltaics Report 2025 puts mainstream commercial module efficiency in the low twenties and notes that the annual improvement is now measured in tenths of a percentage point rather than whole points.
What changed is that a well-specified system no longer throws away the cell's advantage downstream. A decade ago the gap between nameplate yield and delivered AC energy was routinely 12–15% on a residential roof. On a competently designed installation today it sits closer to 6–9%.
Where the watts went between 2018 and 2025
The table below compares a typical 2018 residential specification with a 2025 equivalent at the same roof area. Ranges are used deliberately; exact figures depend on the specific product and the design.
| Parameter | 2018-era specification | 2025-era specification |
|---|---|---|
| Module efficiency | 17–18% | 21.5–23% |
| Module power on a ~1.95 m² frame | 300–330 W | 430–470 W |
| Temperature coefficient | −0.35 to −0.39 %/°C | −0.29 to −0.30 %/°C |
| Inverter weighted efficiency | 96–97% | 98.0–98.6% |
| Battery chemistry and round-trip | NMC, ~92% | LFP, 94–95% cell-level |
| DC and cabling losses (design-dependent) | 3–5% | 1.5–3% |
Two lines in that table matter more than the rest. The temperature coefficient gain means a 8 kW array on a 38°C afternoon holds several hundred watts more than the same area would have produced in 2018. The cabling figure is the one installers control directly, and it is where cheap quotes quietly give the improvement back.
Balance of system is the remaining battleground
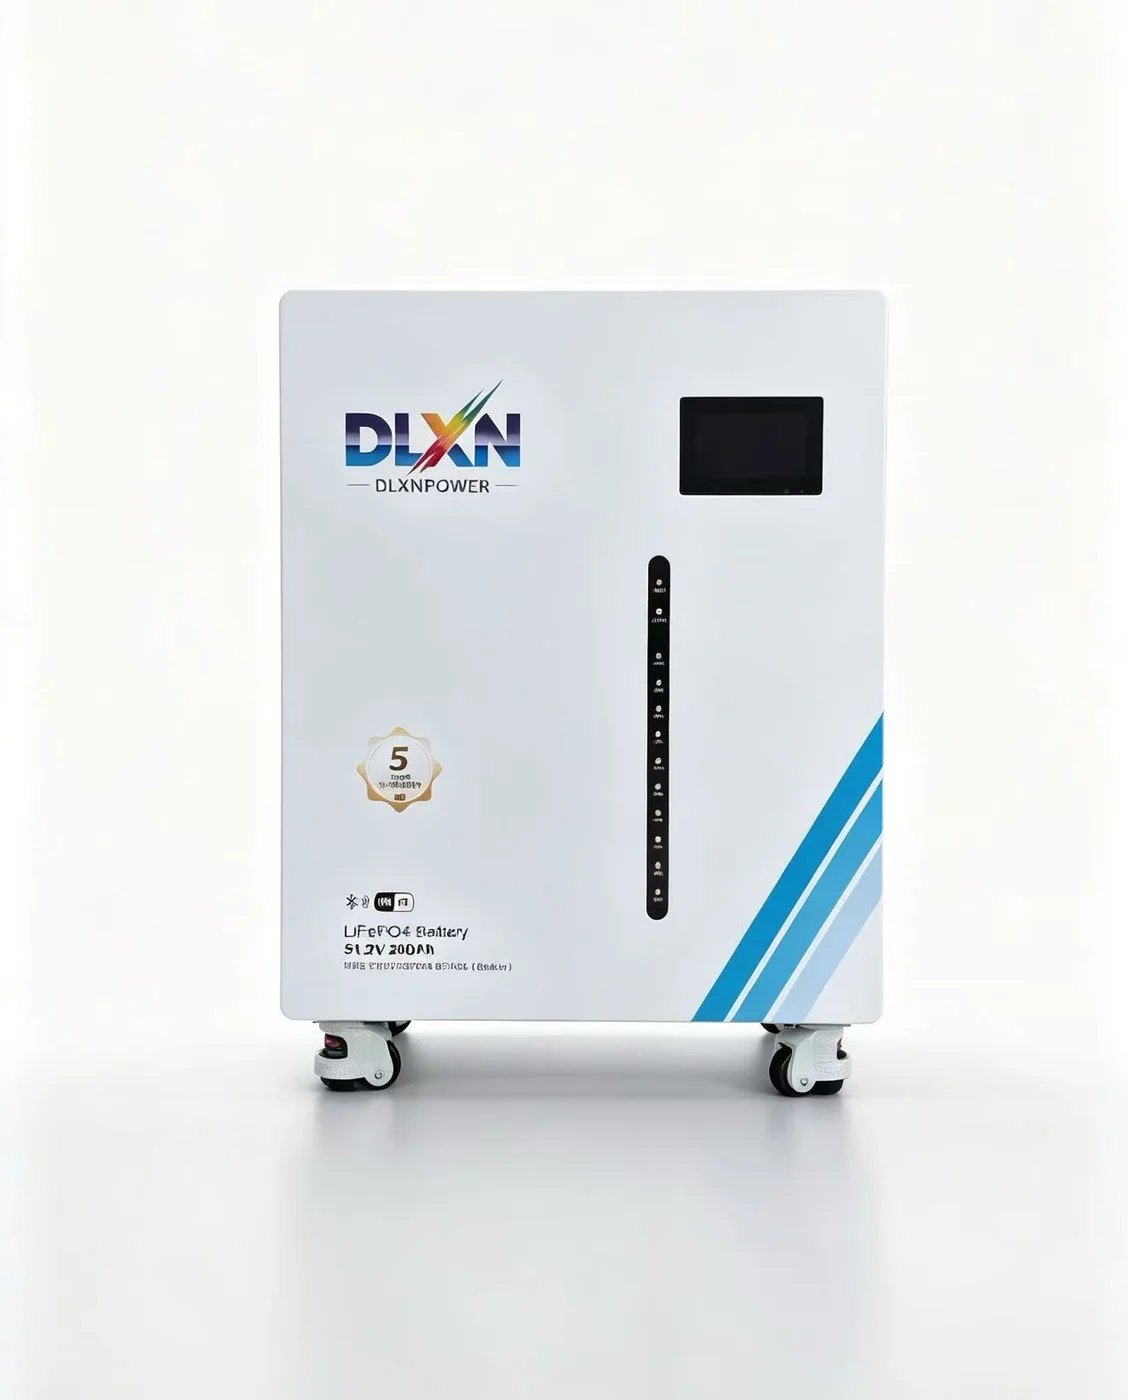
A hybrid inverter rated at 98.4% European weighted efficiency still converts twice when a battery is in the path: DC to AC for the house, AC back to DC to charge, DC to AC again on discharge. That is why a battery with 95% cell-level round-trip can present as 88–91% at the socket. Our own lithium battery range is specified in 5.12 kWh modules at 51.2 V nominal and 100 Ah, rated for 0.5C continuous charge and discharge with 6,000 cycles to 80% state of health. Those numbers are honest at module level; the system-level figure a homeowner experiences will be lower, and any proposal that quotes cell round-trip as if it were AC round-trip is overselling.
In our own QC line the returns we see are almost never the cells. They are MC4 crimps, torque on the battery terminals, and DC cable sized for the nameplate rather than for voltage drop over a 22-metre run.
String design deserves the same scrutiny. A 2025 TOPCon module with a −0.29 %/°C coefficient still drifts with temperature, and mixing orientations on a single MPPT costs more now that the modules are stronger. Two MPPTs on a hybrid inverter will usually beat one oversized string on a roof with an east-west split.
A representative 9.6 kWp / 20 kWh configuration
Consider a configuration that is representative rather than attributed to a named customer: 24 × 400 W N-type TOPCon modules on a south-east / south-west split roof, a 10 kW hybrid inverter, and four 5.12 kWh LFP modules for 20.5 kWh usable, commissioned in April 2025 on a detached house near Utrecht, Netherlands. The roof carries roughly 9.6 kWp across two orientations, which caps peak AC output at about 7.5 kW in practice but spreads production from 07:30 to 19:00 in summer.
Over its first full year, a design of this shape in the Dutch climate typically lands between 8,400 and 9,100 kWh of DC generation, with 88–91% of that reaching the meter after conversion and standby. Self-consumption with a 20 kWh bank in a household running a heat pump sits around 60–70%, depending on how aggressively the battery storage controls are set to charge from forecast surplus rather than from the grid.
The choice of solar panels in this configuration matters less than the two-orientation layout and the MPPT count. Swapping one tier-1 module for another shifts annual yield by a low single-digit percentage; fixing a shading error on the west string can shift it by fifteen.
When the full system is the wrong purchase
A full system with storage is a poor allocation of capital in several identifiable situations, and a good installer will say so before quoting.
- The roof is north-facing at high latitude and shaded by a chimney or mature tree between October and March. Adding storage does not fix a winter production problem; it just finances a smaller deficit at higher cost.
- The household expects to move within three to four years. Storage payback in most European markets runs seven to eleven years on self-consumption alone, and a house sale rarely returns the full battery value.
- The grid connection is reliable and the export tariff is close to wholesale. If every surplus kilowatt-hour is sold at a decent rate, cycling a battery at 90% round-trip to avoid buying back at the same price destroys value.
- The main fuse cannot be upgraded. A 10 kW hybrid plus 20 kWh of storage on a 1×25 A connection will trip, and the fix is a grid application, not a bigger inverter.
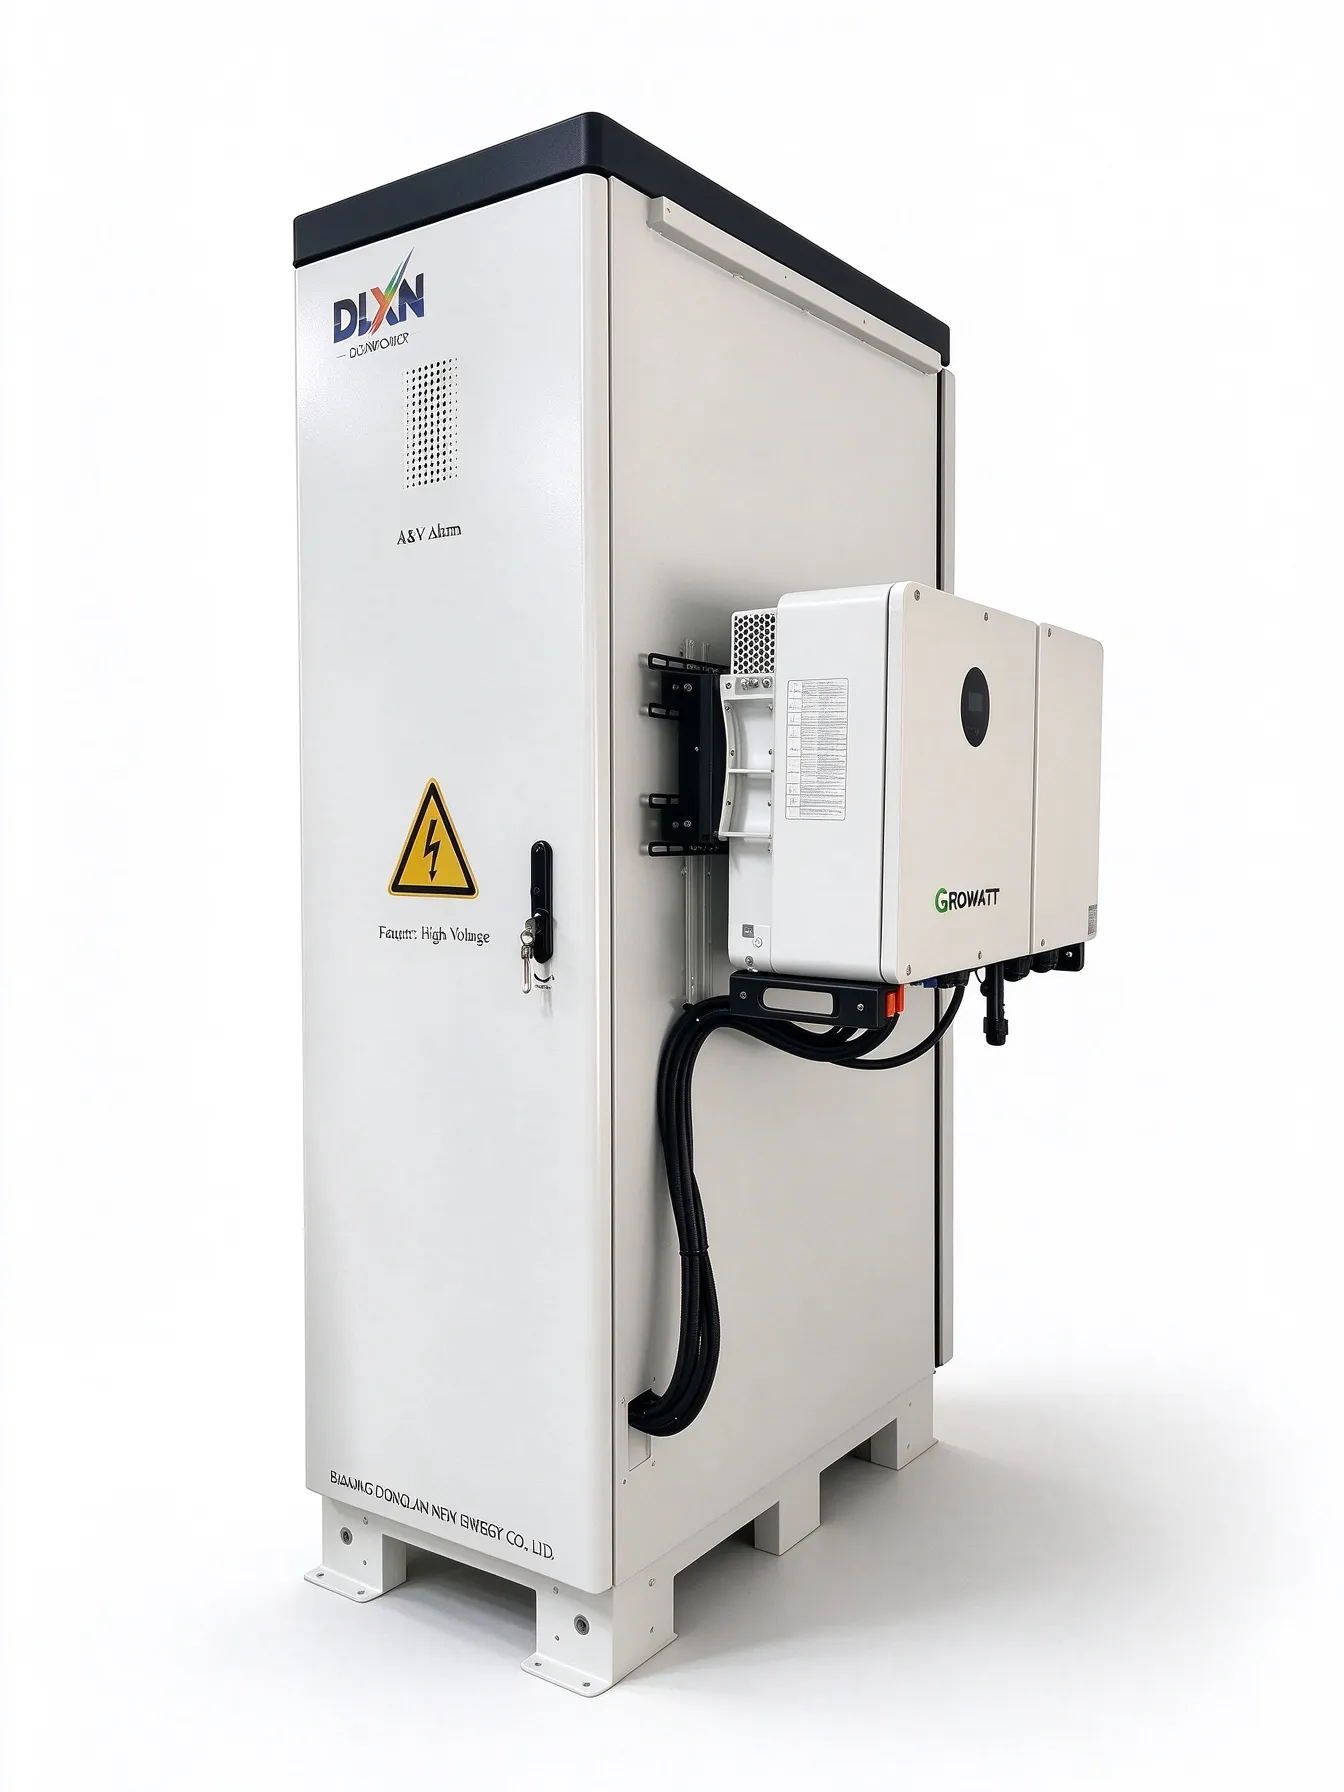
In those cases a grid-tied array without storage, or a smaller array with a later storage retrofit, keeps more of the budget working. The products overview is organised so a system can be staged: modules and inverter first, battery cabinet and EOS carport or Helio2 mounting later, without changing the DC architecture.
What belongs in the specification before signing
Ask for the string layout with module count per MPPT, the calculated DC voltage drop at minimum and maximum cell temperature, and the AC round-trip efficiency of the full battery path rather than the cell figure. Ask which standby consumption the inverter draws at night, because a 20 W overnight draw costs about 175 kWh a year and quietly eats the gain from a higher-efficiency module.
Then check the commissioning record: torque values logged at every terminal, insulation resistance test results, and a first-week production curve compared against the design model. In our experience the difference between a system that returns 8,900 kWh and one that returns 8,200 kWh over a year is almost entirely documentation and torque, not silicon.
Related products
In-stock models that match this article — specs and RFQ on each page.